The Bug You Can't Reproduce
Everything worked in the lab. Your firmware passed validation, your test environment was stable, and you shipped with confidence.
Then the reports start coming in. Devices are watchdog resetting in the field. Not all of them. Not consistently. Just enough to be concerning.
Naturally, this starts five minutes after you told your boss, “Yeah, it’s rock solid.”
You dig into it, but the logs are incomplete. There's no clear pattern, and there's no way to reproduce it locally. You can't attach a debugger. You can't recreate the environment. Whatever caused the issue is already gone.
So you do what most teams do: you guess.
The Real Problem with Embedded Debugging
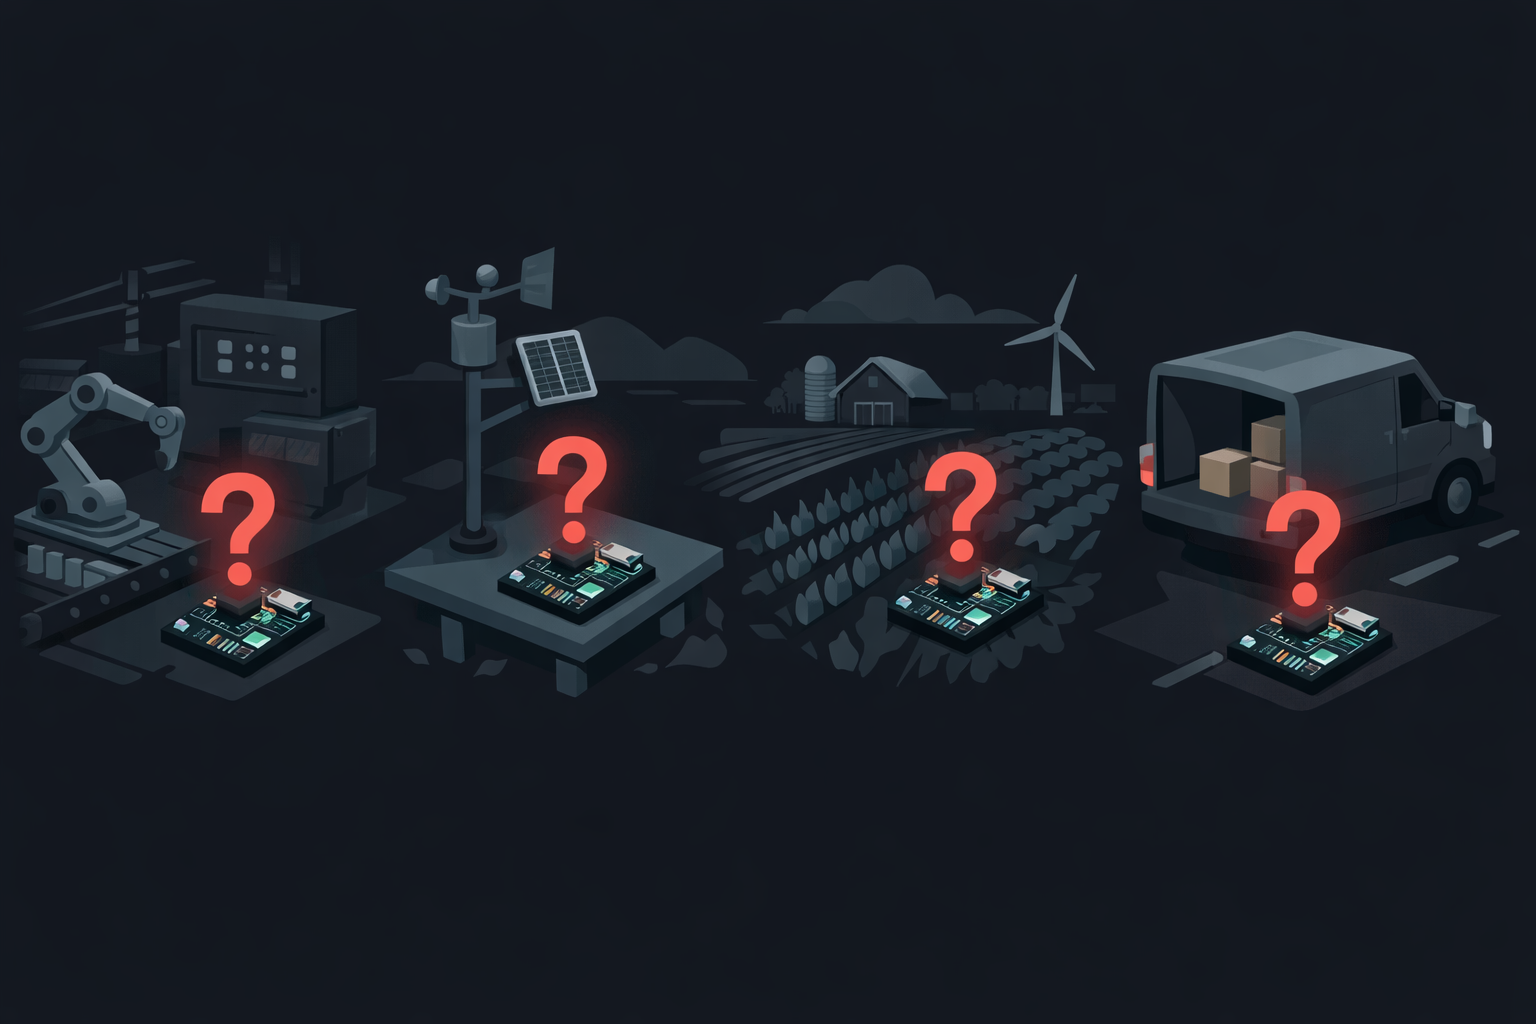
If you're working on embedded or IoT systems, this scenario isn't a rare edge case, it's the norm. You might have thousands or even hundreds of thousands of devices, operating in different environments, experiencing issues you can't physically access.
And the biggest challenge? Reproducing the problem is often harder than fixing it.
A Real-World Example
One team was managing a wireless fleet with over 500,000 deployed devices. Occasionally, devices would trigger watchdog resets, restart unexpectedly, or recover without explanation. There was no obvious pattern.
The team spent weeks reviewing logs, trying to reproduce the issue, and analyzing system behavior, but they couldn't find the root cause. Because they were missing one critical thing: what actually happened before the reset.
Why Traditional Logging Fails
Most embedded logging strategies fall short in exactly these scenarios, and the reasons compound on each other.
1. Logs Are Too Limited
Memory is constrained and logging is often reduced or disabled in production builds. You end up capturing fragments, enough to know something happened, but not enough to understand what.
2. The Most Important Data Gets Overwritten
Even when logs exist, buffers are small and critical events overwrite older context. By the time you investigate, the evidence is already gone.
3. You Only See the Aftermath
Most systems capture the crash, the reset, and the recovery, but not the sequence of events that caused them. You're left staring at a consequence with no way to trace it back to its origin.
Traditional Logging
You see what happened — but nothing about why.
Pre-Trigger Logging
You see the full story — the escalation from warning to fault, with the exact code path.
The Missing Piece: Context Before Failure
The root cause of a failure almost always happens before the failure itself.
Not during the crash. Not after reboot. But in the seconds, or milliseconds, leading up to it. Without that context, you're debugging blind.
What Changed Everything
When this team integrated uLogger, the goal wasn't just to log more data, it was to capture the right data.
1. Pre-Trigger Logging
Instead of logging only when something goes wrong, uLogger continuously monitors events. When a failure occurs, it preserves the full history leading up to it. So instead of seeing nothing, the team could see everything that led to the failure.
2. Full Stack Trace Capture
At the moment of failure, uLogger captured the exact instruction where execution stopped, the enclosing function, and the full stack trace. No guessing. No ambiguity.
3. Timeline + Root Cause
This is where things got interesting. The issue turned out to be inside a radio interrupt handler, code provided by a third party. Without context, this would have been nearly impossible to diagnose.
But with uLogger, the team could see the sequence of log messages leading up to the issue, the system state before entering the interrupt, and the exact point where execution got stuck. It wasn't just a crash — it was a story.
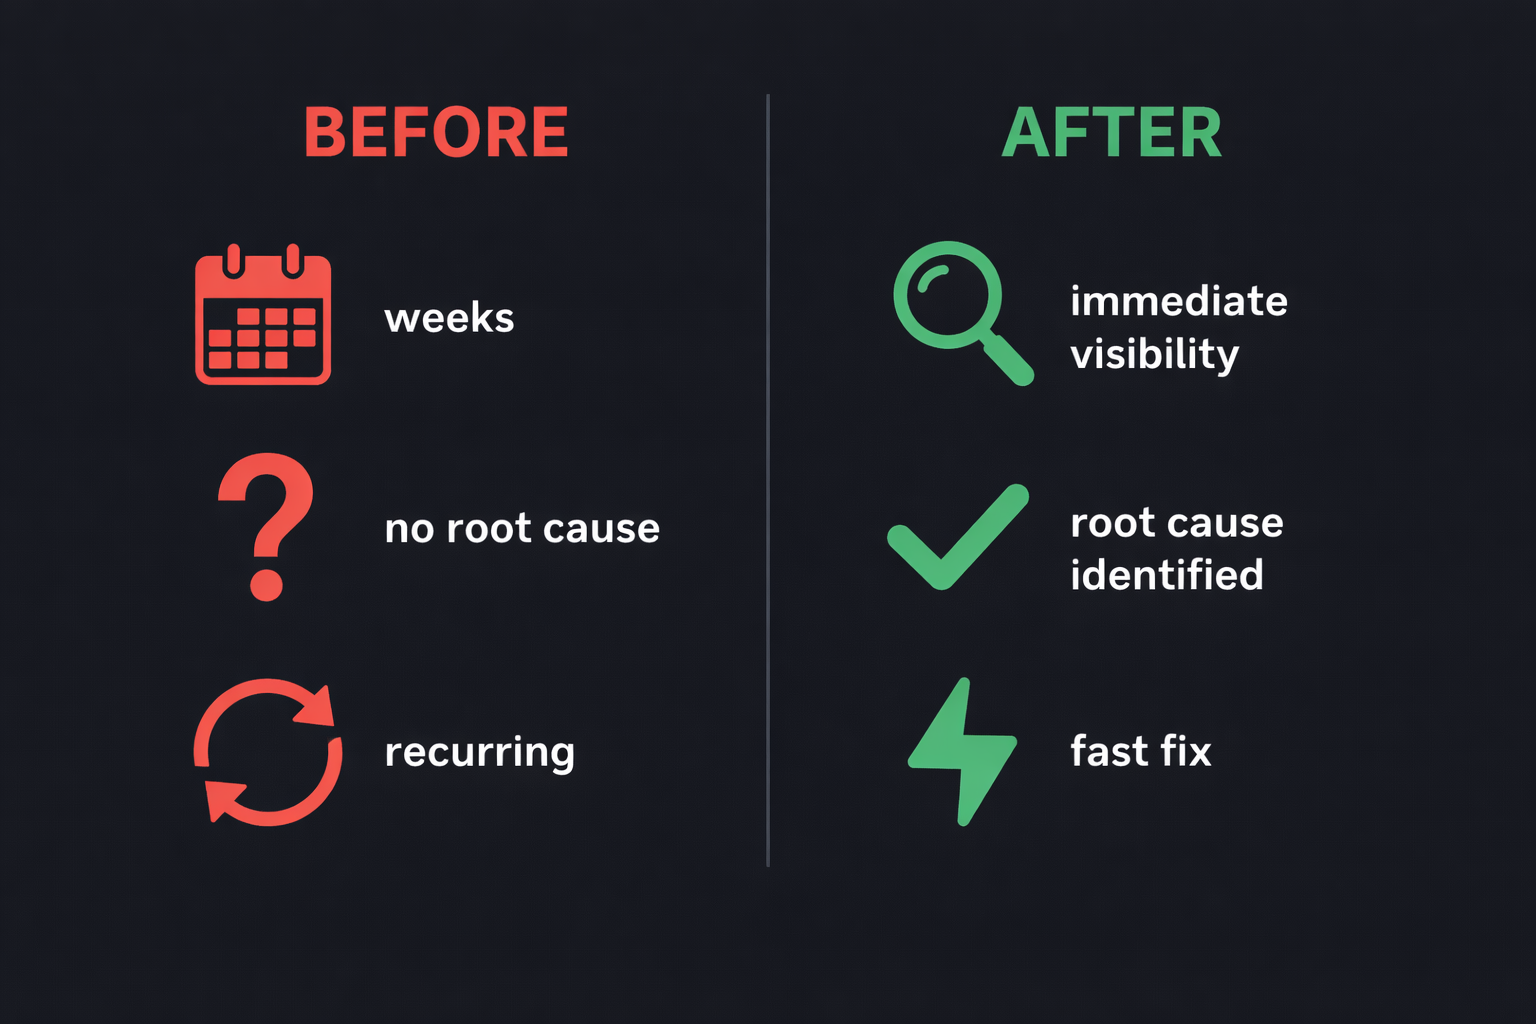
From Weeks of Guessing to Immediate Resolution
Before uLogger, the team had spent weeks investigating with no clear root cause and ongoing uncertainty about whether the issue might recur. After uLogger, they had immediate visibility into the failure, clear identification of the offending code path, and a fast resolution.
What was once a mystery became trivial to fix.
Rethinking What You Log
Most teams ask: "What should we log?" — balancing diagnostic value against battery, memory, and CPU overhead. uLogger nearly eliminates that trade-off: context is always captured but doesn't consume resources until you need it.
The better question is: "What will we wish we had when this fails in the field?" Because you won't get a second chance to capture that moment.
Debugging embedded systems doesn't have to mean reproducing issues endlessly or deploying blind fixes. With the right approach, you can see what actually happened, understand why, and fix it with confidence.
Why We Built uLogger
After years of dealing with unreproducible field failures, one thing became clear: the hardest bugs aren't the ones you can see — they're the ones you can't.
uLogger was built to capture pre-failure context, preserve critical debugging data, and give engineers real visibility into production systems. So instead of guessing, you can finally see what really happened.
If your devices are already in the field, failures aren't a possibility, they're inevitable. The only question is whether you'll know what caused them.